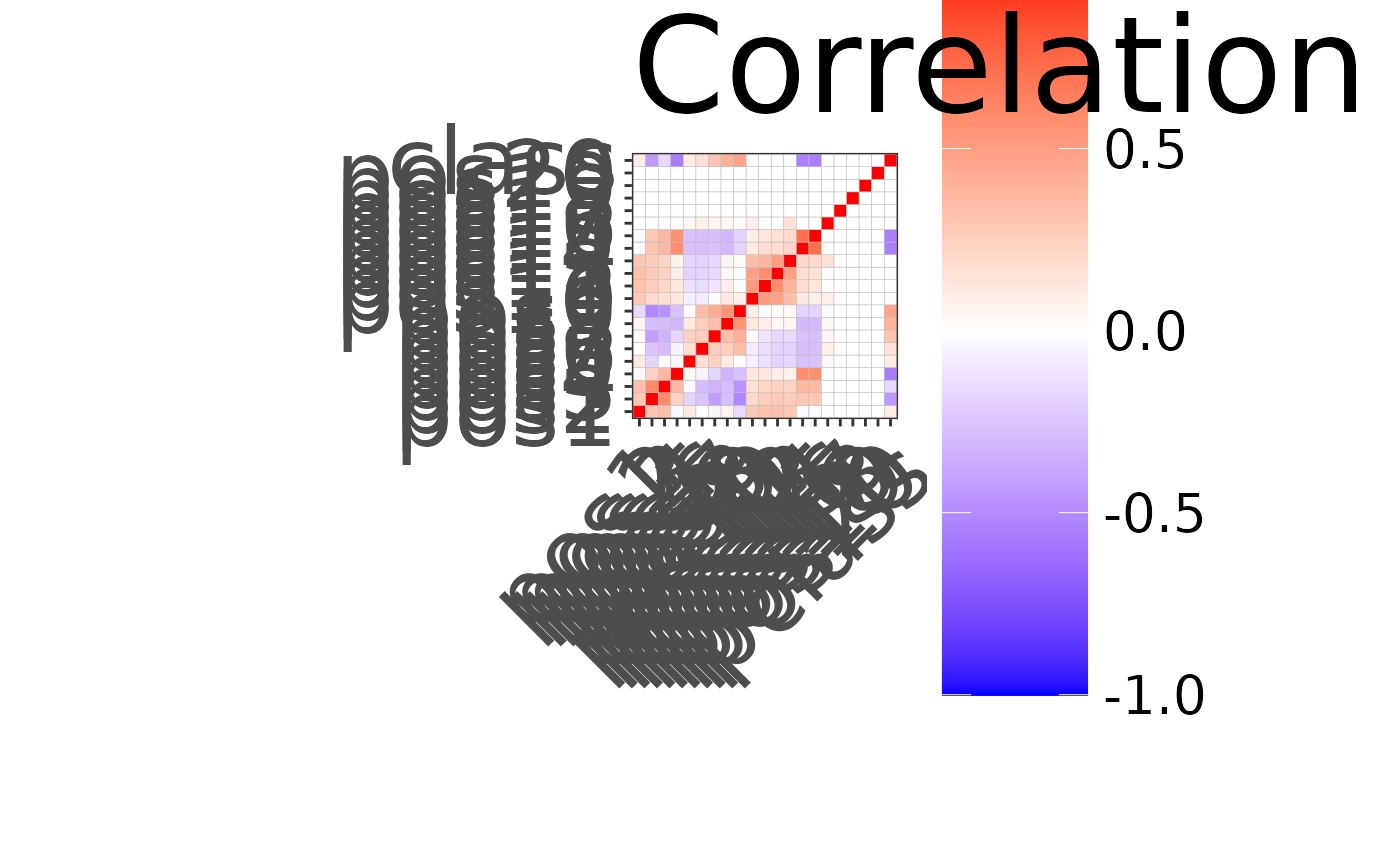
Plot correlation heatmap.
mi_plot_cor.RdPlot correlation heatmap.
Examples
data(mi_data_procID)
data_num <- mi_to_numer(mi_data_procID)
mi_plot_cor(data_num)
#> Warning: the standard deviation is zero

mi_plot_cor.RdPlot correlation heatmap.
data(mi_data_procID)
data_num <- mi_to_numer(mi_data_procID)
mi_plot_cor(data_num)
#> Warning: the standard deviation is zero
